Civil Engineering

HORIZON


Home

     Civil Engineering Horizon----Continuously Published Online Journal

Author's Profile

Abstract

Introduction

Methodology

Result Discussion

Conclusions

References

Contents

Instructions to Authors

Editorial Board

Tell-A-Friend

Civil engineers website

Profile of Civil Engineers

Book Store

Conferences

Scholarships

Contact Us

Featured Links

Higher Education

Learning Support

Job Search

Computers

University/College

WATER QUALITY EFFECT ON CONCRETE COMPRESSIVE STRENGTH: 

OGUNPA STREAM WATER CASE STUDY

Gbenga Matthew AYININUOLA

RESULTS AND DISCUSSIONS

The chemical constituents of the three water samples were determined immediately the cubes were cast.  The results of the chemical properties of the water samples are displayed in Table 1.  At the end of 7th, 14th, 21st, 28th, 56th and 84th days, eights cubes from each mix type and water sample were taking for compressive strength determination.  Altogether, 48 cubes were crushed at every test day.  At the end of 84th day, 288 cubes had been crushed.  The results of the compressive strength of concrete cubes were displayed in Table 2.

Table 1: Water test results

Parameter tested           UI potable       Middle Ogunpa       Lower Ogunpa

(mg/l)                                   water                water                         water

Sodium, Na                          230.0               650.0                         720.0

Potassium, K                        310.0               760.0                         780.0

Calcium, Ca                          200.0               310.0                         350.0

Sulphate, SO42-                    15.1                 19.5                           20.3

Nitrate, NO3                         0.11                 0.14                           0.18

Carbonate, CO3                    270.0               450.0                         520.0

Bicarbonate, HCO3              260.0               970.0                         1010.0

Chloride, Cl                          220.0               270.0                         320.0

Fluoride, Fl                           1.1                   1.6                             1.7

Phosphate, PO4                     27.5                 38.0                          40.0

Iron, Fe                                 1.3                   1.7                             1.8

Copper, Cu                           1.3                   1.8                             1.9

Magnesium, Mg                   0.9                   1.1                             1.5

Manganese, Mn                    1.1                   1.3                             1.5

Zinc, Zn                                1.3                   1.5                             1.7

Lead, Pb                               0.11                 1.2                             1.4

Cadmium, Cd                       0.09                 1.4                             1.6

Acidity                                  0.06                0.14                           0.16

pH                                         6.7                   9.6                            9.8

Except pH and level of acidity, the unit is mg/l

Table 2 The cubes compressive strength

Period of    Water      Concrete            Compressive Strength (N/mm2)

cube                 sample         mix                   minimum      maximum    mean

crushing           type

7th day              UI water       1:1:2                   24.2              27.7             26.0

                         MO water                                24.0              25.2             24.9

                         LO water                                 22.4              24.1             23.2

                         UI water       1:1.5:3                19.8              22.6             21.4

                         MO water                                20.1              21.5             20.9

                         LO water                                 19.3              20.7             20.2

14th day            UI water       1:1:2                   27.4              30.5             29.0

                         MO water                                26.4              28.3             27.2

                         LO water                                 25.6              26.8             26.1

                         UI water        1:1.5:3               25.4              27.7             26.6

                         MO water                                21.7              23.6             23.6

                         LO water                                 21.1              22.3             21.9

21st  day           UI water        1:1:2                  34.1              36.3             35.1

                         MO water                                23.7              25.2             24.1

                         LO water                                 22.9              24.0             23.5

                         UI water        1:1.5:3               28.7              31.8             30.5

                         MO water                                21.8              23.7             22.4

                         LO water                                 20.7              22.1             21.5

28th day            UI water        1:1:2                  41.5              44.7             43.2

                         MO water                                22.6              24.1             23.7

                         LO water                                 18.7              20.4             19.8

                         UI water        1:1.5:3               33.1              34.0             34.1

                         MO water                                20.1              22.0             20.6

                         LO water                                 18.9              20.0             19.2

56th day            UI water        1:1:2                  47.6              49.3             48.5

                         MO water                                18.9              20.3             19.7

                         LO water                                 18.2              19.7             19.3

                         UI water        1:1.5:3               38.9              41.7             40.1

                         MO water                                18.7              20.8             19.1

                         LO water                                 18.1              19.4             18.8

84th day            UI water        1:1:2                  49.6              52.1             51.6

                         MO water                                17.9              19.4             18.8

                         LO water                                 16.8              18.2             17.8

                         UI water       1:1.5:3                42.6              44.8             43.2

                         MO water                                16.9              18.0             17.6

                         LO water                                 16.2              17.5             16.7

MO  = Middle Ogunpa;  LO = Lower Ogunpa


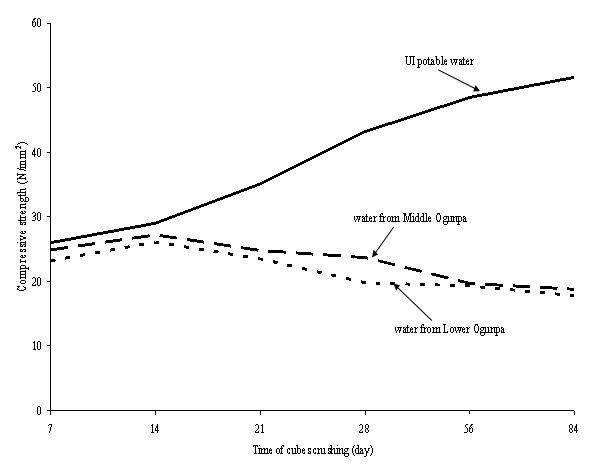
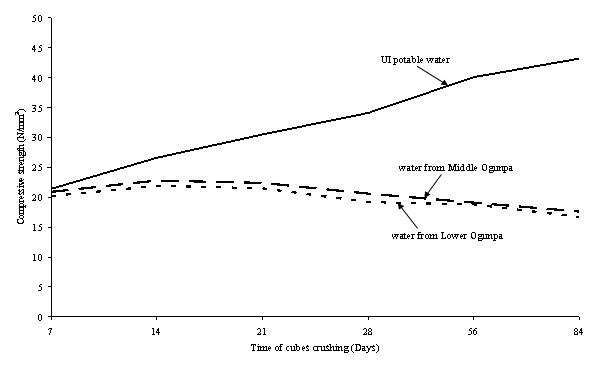
The results got from the chemical analyses showed that the three water samples have different concentrations of chemical composition.  The concentrations of chemicals in water sample at Lower Ogunpa stream were higher than that of the middle one as a result of discharging of more wastewater into the stream at this section.  Moreover, the chemical properties of potable water from the University of Ibadan Water Treatment Plant were lower than that of water from Ogunpa stream.  The concentration of Na and K of Ogunpa stream almost doubled that of potable water.  The level of acidity, pH, CO3- and HCO3- of water at Lower Ogunpa were higher than that of Middle one due to presence of more impurities as water moves downstream.

The compressive strength of cubes produced with potable water increased with ages as shown in Figures 1 and 2.  Pre-28 days, the increment in strength was very rapid but beyond, its rate of strength development reduces as expected for a normal concrete.  On the other hand, the strength development of cubes cast with Ogunpa stream water was not as that rapid on comparing with those of potable water as shown in Figures 1 and 2.  The cubes started to loose compressive strength after 14th day of concreting.  The highest compressive strength for concrete cubes of mix ratio 1:1:2 cast with water got from Middle Ogunpa was 27.2N/mm2 whilst that of Lower Ogunpa was 26.1N/mm2

Referring to Table 2 for concrete mix ratio of 1:1:2, the expected compressive strength should be 40N/mm2 or thereabout.  Only cubes cast with potable water have mean compressive strength of 43.2N/mm2.  On the other hand, the 28th day mean compressive strengths of concrete cubes of mix ratio 1:1.5:3 cast with water from Middle and Lower Ogunpa  were 20.6 and 19.2N/mm2 respectively. For a normal concrete cube of mix ratio 1:1.5:3, the expected 28th day compressive strength should be 30N/mm2 or thereabout.  This shows clearly that the water from Ogunpa stream contains chemicals that retard development of concrete compressive strength. On comparing with chemical constituents of portable water, these can be attributed to the presence of very high concentrations of Na, K, SO42-, Cl-, CO3-, HCO3- and PO4- .  In addition, the level of acidity of Ogunpa stream water was higher than that of potable water. Moreover, the Ogunpa stream water has high pH value prohibiting its usefulness in concrete production.  The compressive strength values of cubes cast with water from Lower Ogunpa stream were lower than that of Middle Ogunpa.  This can traced to presence of higher concentrations of K, Na, SO42-, CO3- and Cl- in water at Lower Ogunpa stream section.

Figure 1: Compressive strength of concrete cubes with mix 1:1:2


Figure 2: Compressive strength of concrete cubes with mix 1:1.5:3

Abstract   Introduction   Methodology    Result Discussion   Conclusions   References

Other Sections

Structural Engineering  Geotechnical Engineering  Construction Materials

Water Resources Engineering  Transportation Engineering  Environmental Engineering

Construction Technology & Management  Quantity Surveying  Professional Issues


External Links (papers published in other journals)

Research papers in civil engineering

All the civil engineers (academicians, professionals, researchers, students) are invited to contribute. They can submit their technical paper/essay/news item and any other interesting information to horizon@webinfolist.com

Please submit your articles in MS-word format and picture, figures, photos etc in .jpeg or .gif format.

Guidelines for preparation of technical papers are available at Instructions to Authors

Disclaimer: The news, views and analysis published in the technical papers/essays are totally from the authors and website is not responsible for them.


Join the mailing list to get informed about latest publications

Last updated on Thursday November 29, 2012